Basic Reporting
📦 Basic — included with every Connie account. It lives inside Flex, costs nothing extra, and needs no setup. It's role-gated to administrators and supervisors.
Basic Reporting answers one question: "What happened?" It comes in two halves:
- 🟢 Real-time — what's happening right now (Teams View, Queues Stats)
- 🕓 Historical — what happened over time (native Flex Insights)
This guide is for CBO administrators and supervisors. (Agents don't see reporting.)
1. What it is & where to find it
Basic Reporting lives inside Flex — there's nothing extra to install. You'll find it in the Flex navigation:
| Where | What it shows |
|---|---|
| Queues Stats | 🟢 Real-time queue activity — who's available, what's waiting |
| Teams View | 🟢 Real-time agent activity, organized by department |
| Dashboards | 🕓 Historical reports, including your curated Standard Reporting view |
| Analyze | 🕓 Build your own report from scratch (drag-and-drop) |
Your account comes with a Standard Reporting dashboard already built for you. Start there — it answers the everyday questions out of the box. Reach for Analyze only when you need something custom.
2. Who can see reporting
Reporting is role-gated:
- ✅ Administrators and supervisors with the Insights role can see it.
- ❌ Agents cannot — reporting never appears in an agent's view.
Adding a new supervisor is a quick, per-account step — ask your Connie team to grant the Insights role to their account.
3. Customizing dashboards
Your built-in dashboards are read-only by design, so you can't accidentally break them. The rule of thumb: clone, don't fight them.
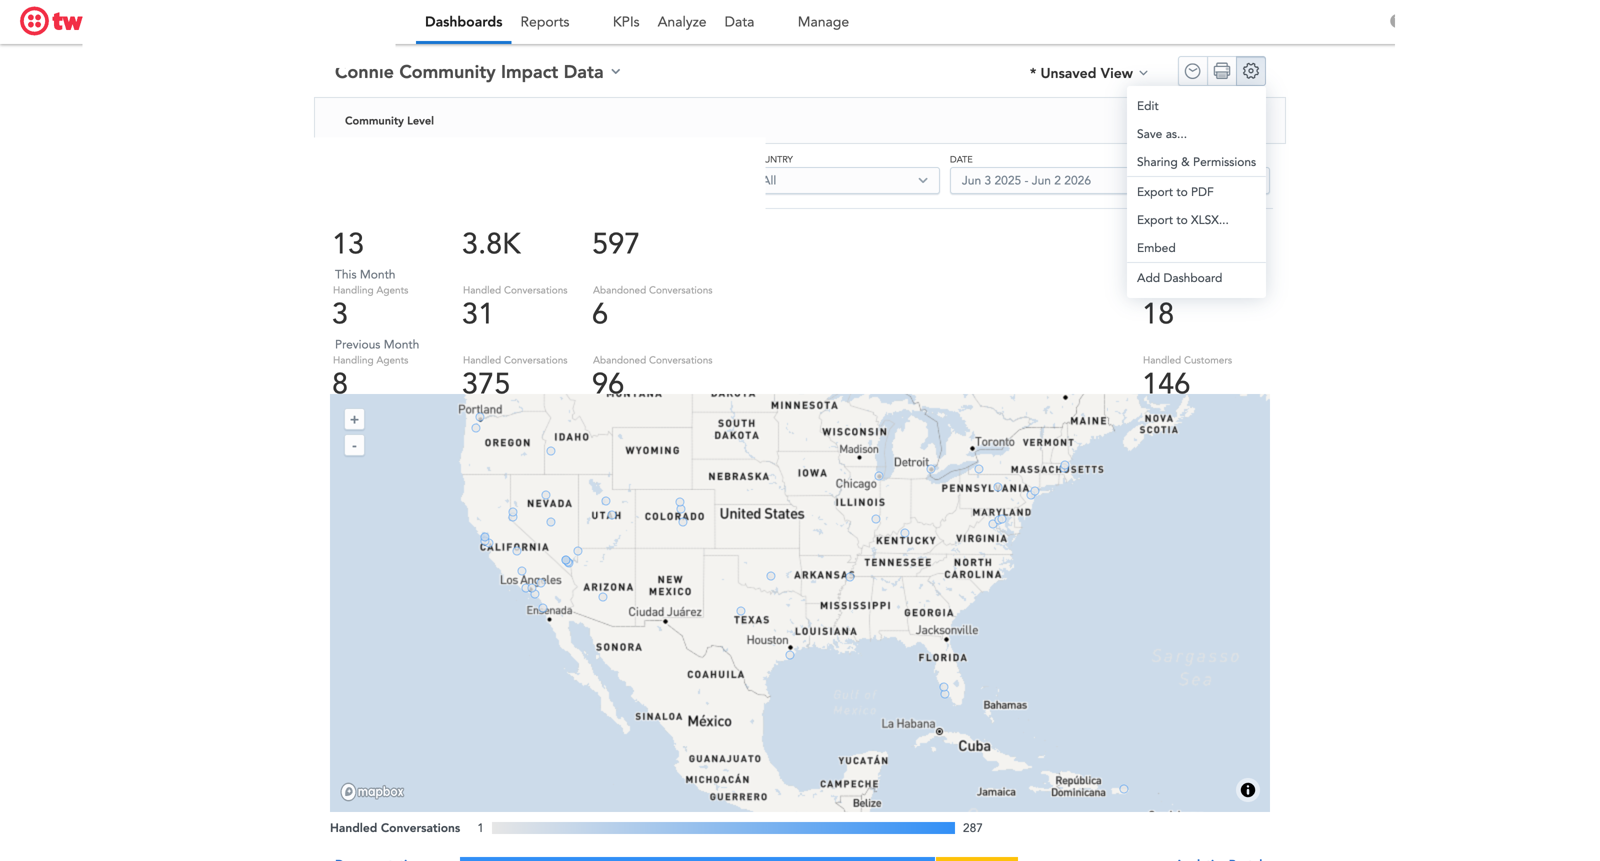
To make your own version of a dashboard: open the dashboard menu (the gear icon, top-right) and choose Save as… to make a copy you can edit freely.
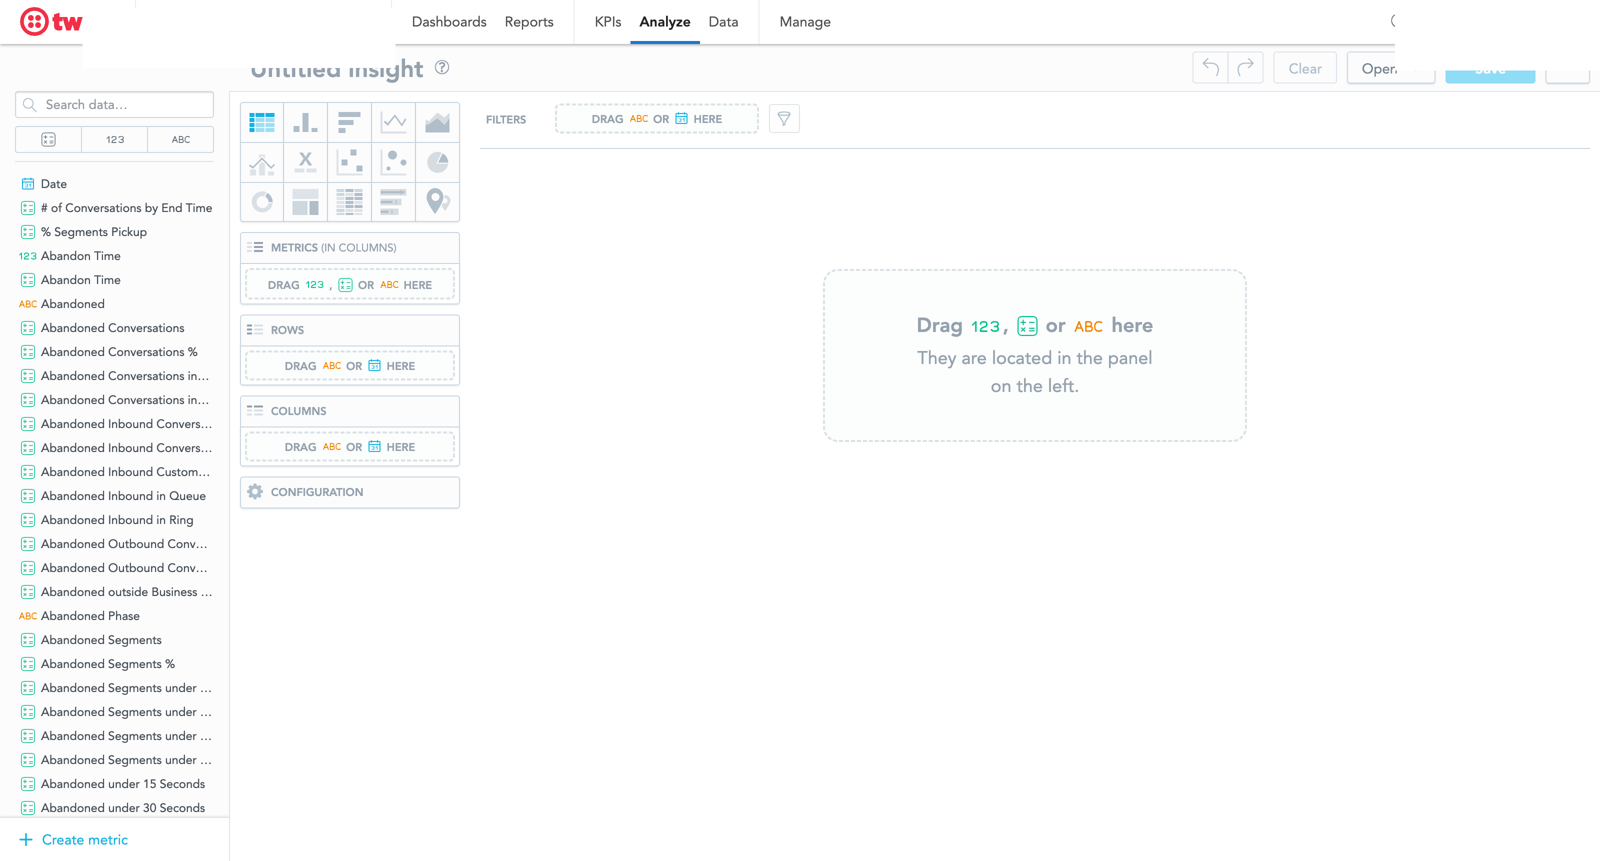
To build a report from scratch: open Analyze. Drag metrics and dimensions from the left panel into the Metrics, Rows, and Columns zones. It's all drag-and-drop — no code required.
For the full feature reference, see Twilio's Flex Insights end-user guide.
4. Switching time frames
Every dashboard has a date filter at the top. There are two ways to set it:
- Quick-picks — the last 7 / 30 / 60 / 90 / 180 / 365 days, one click each.
- Custom range — pick a specific From and To date.
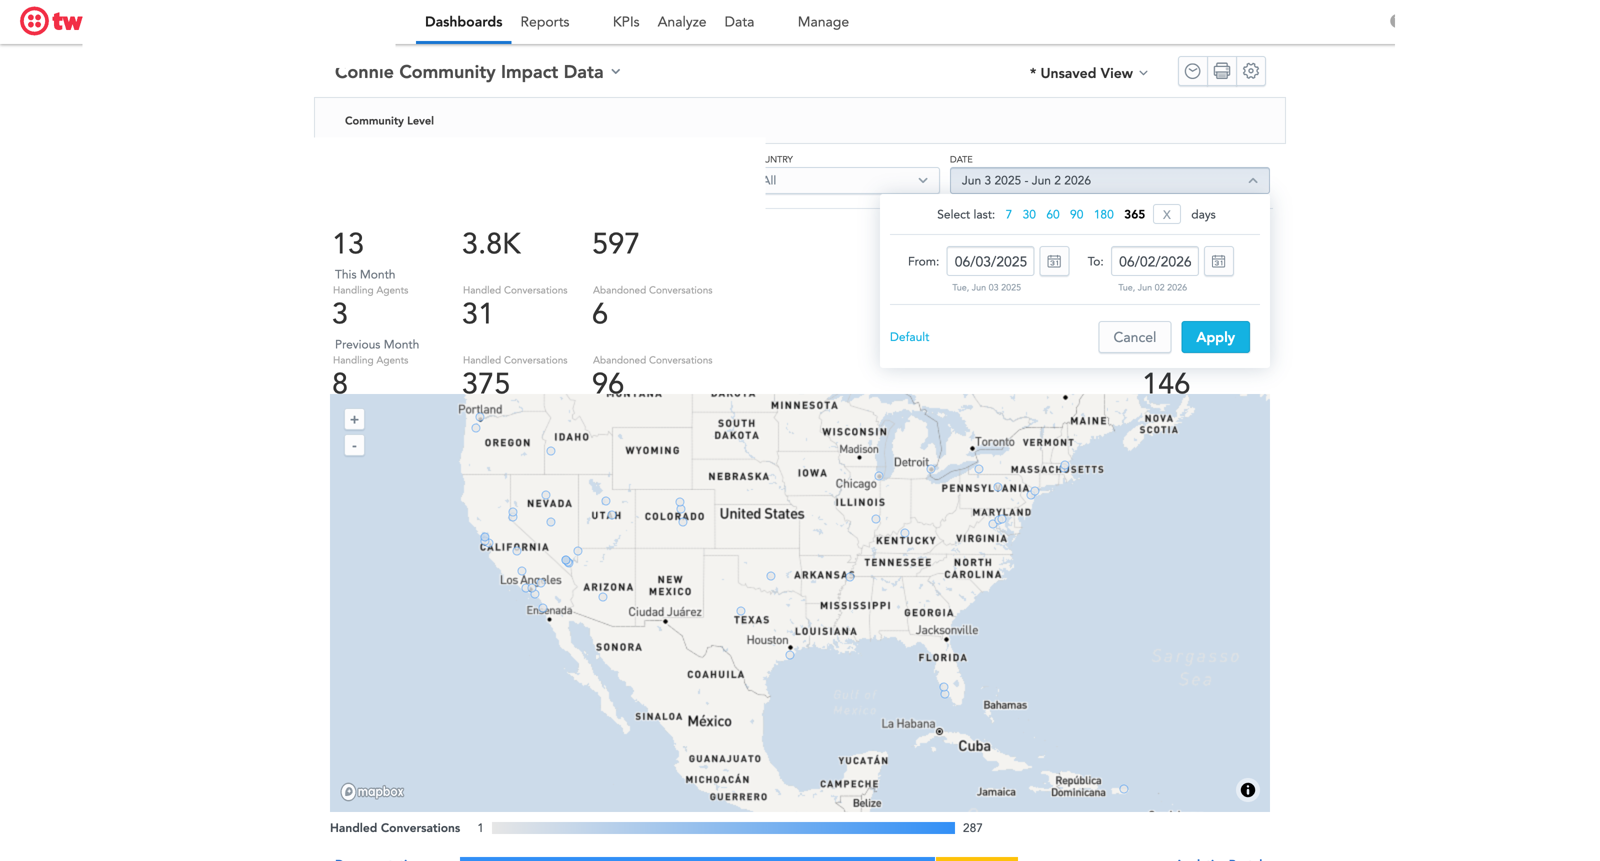
The quick-pick buttons stop at 365 days. To see the full history, use the custom From/To range instead.
5. How far back the data goes
About 24 months of history is available. The exact window can change, so if you need to rely on a specific date range, check with your Connie team first.
6. Exporting & downloading 📌
This one trips people up, so be precise: whether you can download depends on which surface you're on.
| Surface | Export today? | How |
|---|---|---|
| Native Insights dashboards | ✅ Yes | Dashboard menu → Export to PDF or Export to XLSX |
| connie.plus Data Center reports | ⏳ Not yet | Raw-data download is on the roadmap; no release date is committed |
There's no blanket "you can't download." From a native Insights dashboard, export to PDF or XLSX from the dashboard menu (the same menu shown in Customizing dashboards, above). Raw-data download from the connie.plus Data Center is on the roadmap, with no committed release date.
A few terms, in plain language
Full definitions live in the Concepts & Glossary. The ones you'll see most:
| Term | What it means |
|---|---|
| Offered | A conversation that reached your team — whether or not it was answered |
| Handled | A conversation an agent actually worked |
| Missed / Abandoned | A conversation that wasn't answered (the caller hung up or it timed out) |
| Department | The program a worker belongs to (your service lines) |
| Queue Time | How long a conversation waited before an agent picked it up |
Basic vs. Advanced
Basic tells you what happened. Advanced (a paid upgrade) takes that same data and reshapes it into funder-, county-, and board-ready reports. → See Advanced
What's not in Basic:
- Funder / grant / board exports — the "already in the shape your funders want" formatting → Advanced
- Community-impact reporting (SDOH / CIE outcomes) → Advanced
Getting help
- Need a new supervisor added to reporting? Ask your Connie team to grant the Insights role.
- Want a custom dashboard built for your program? Connie can build curated dashboards for you — just ask.
Need help? Visit Get Support or reach out to your Connie team.